

Bar Replay Feature
Bar Replay feature is extremely useful for visual backtesting with ease. Also it helps in identify past performance as well as which indicators / systems are repainting in nature. So user can check before following them .
Analyze market trends, detect patterns, and make smarter investment decisions with our powerful EOD analysis software.
Powerful Stock Screening & Backtesting at Your Fingertips
Includes Chart Pattern Scanners, Breakout Analysis, Volume Analysis, Moving Average Analysis, and more.
Build and scan stocks using your own strategy without writing a single line of code.
Test the efficiency of your strategy on historical data before making trading decisions.
Analyze and filter thousands of stocks in seconds using YStocks' robust scanning engine.
Best EOD Technical Analysis Software for the US stock market at just $12/month or $100/year (inclusive of all taxes)....
Save lot of Time
The real beast
Plots Automatically
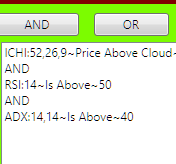
Best Technical Analysis Software for US Stock Market at affordable price. No matter whether you are price action trader , or Moving Average follower or Indicator based trader or candlesticks pattern follower or even RSI Divergence trader. You can even mix more than 2-3 indicators and create custom scans for own requirment without any coding.
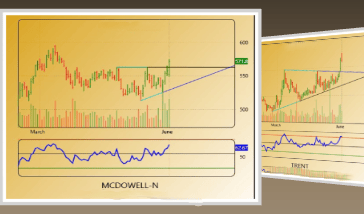
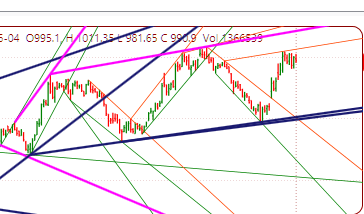
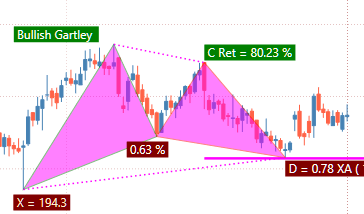
Feel the real power of trendlines with help of auto trendliens & Trendline scanner with option of finding stocks which has found support / resistance of trendlines or break. Simple pattern like double bottom / top and complex patterns like Wolfe waves or head and shoulder pattern scan available. ABC Pattern , Harmonic Patterns and EW 4th Wave are like icing on cake. These features makes it Best Technical Analysis Software for US stock market.
Not just MA crossover but rare to find scans like MA Slope or MA convergence
upto five different MA available. You can also mix MA with indicators, For
example scan MA bullish cross where RSI is above 50 or any other
value.
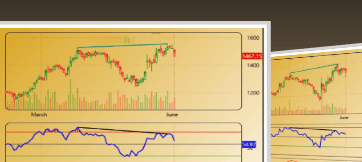
Not Just Divergence of Indicators like RSI / MACD but you can
also scan where these indicators has given breakout of last 'N' days with price
breakout
Bar Replay feature is extremely useful for visual backtesting with ease. Also it helps in identify past performance as well as which indicators / systems are repainting in nature. So user can check before following them .
Not all programmers are good traders in similar way we don't expect traders to be good programmers. You won't need to write even a single line of code in this software. It's all about Select, Click and Play

We provide instant support for all issues related to troubleshooting and software related queries. Help Videos Tutorial is also available for help. However we are unable to help you on queries related to Technical Analysis. .
Two Weeks Fully functional free trial.
YStocks works only on Windows Operating System
Download link for Windows 7 / 8 / 10 / 11
Download Windows installer
Windows 7 users
Dotnet 4.5.2 or higher is required, contact ystocksusa@gmail.com for
support .