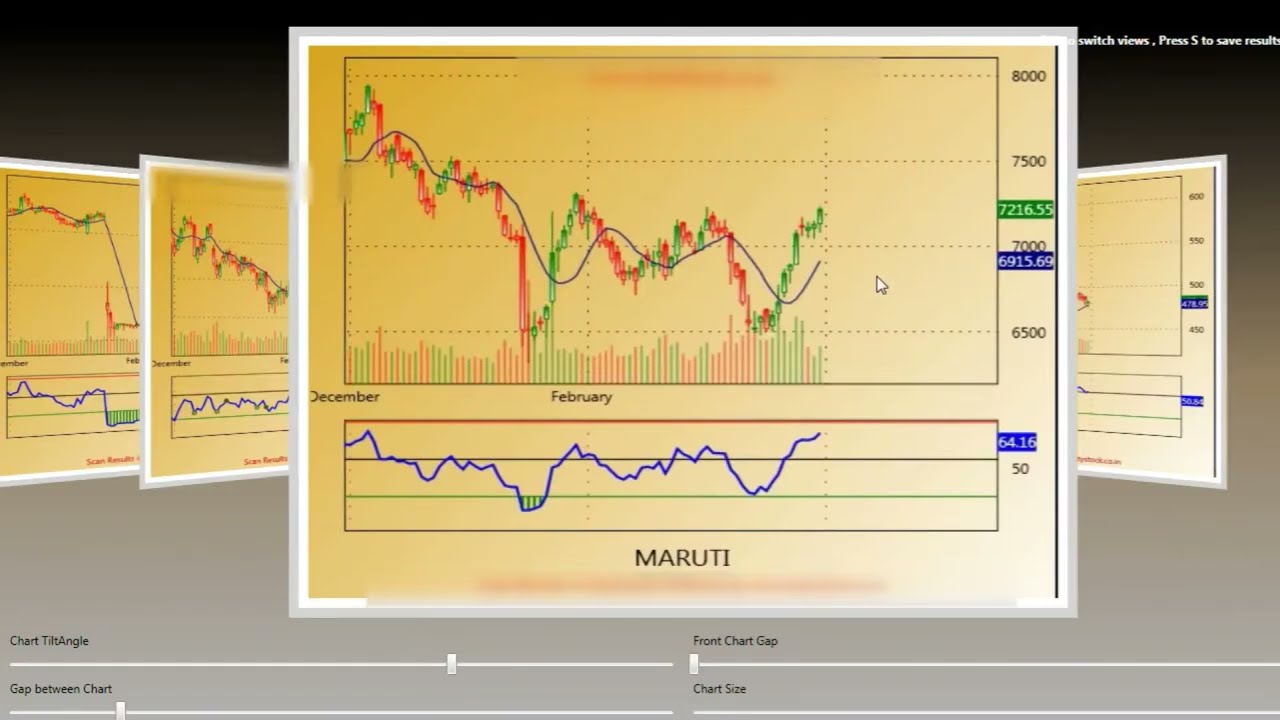
Scan Moving Averages
Explore Moving averages in better way
MA Convergence Screener
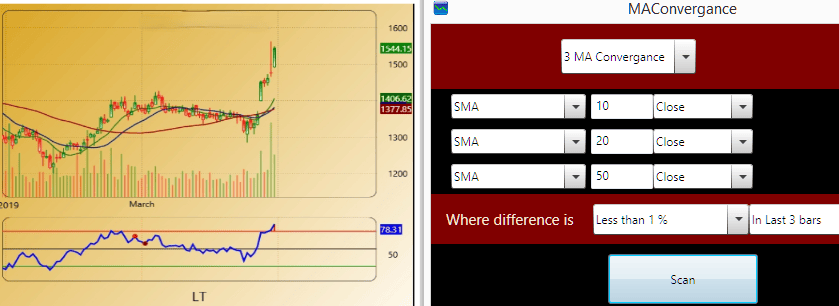
Moving Average convergence shows the relationship between two or more
different moving averages of the same symbol / stock. MACD indicator shows
the convergence of 2 moving averages but what if user want to see the
convergence of more than 2 moving averages ? . Here this scan comes real
useful. It can show convergence of upto five different moving averages
Stocks normally goes into consolidation phase before giving good breakout,
Convergence of moving average happens during this consolidation phase and in
most of the cases consolidation phase gets over when 3 or moving average
comes very very near to each other. It is somewhat similar to the crossover
of 3 or more moving averages.
Moving Average Slope
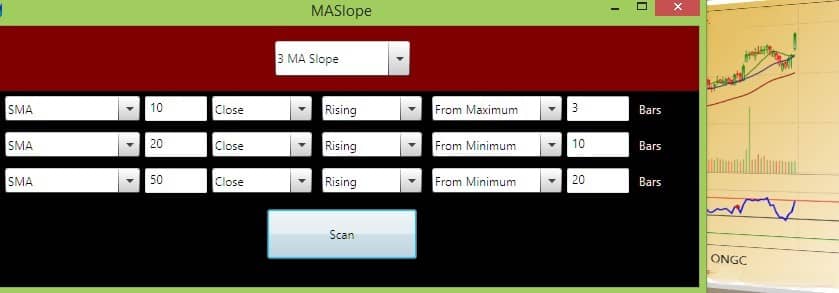
Slope of moving average reflects the trend of stock / symbol. MA Slope scan
help us to find stocks where slope of moving averages is rising or falling
from last 'N' number of bars.
This scan can show the slope of 3 different moving averages.It has three
different option with help of them we can find out stocks where MA Slope is
rising / falling from Minimum or Maximum or exact "N" number of bars.
If option From Minimum of 10 days is selected then it shows stocks where MA
slope is rising from minimum of 10 days or more, it may be rising from 20 or
even 50 days but if option selected is rising from Maximum 3 days then it
means it was falling previously and started rising in any of last 3 bars.
Moving Average Crossover
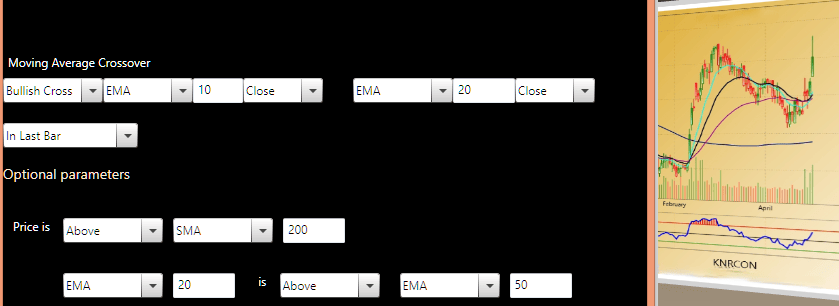
Almost every trader is familiar with MA crossover. With help of this scan
you can check crossover happened in last bar or upto last 10 bars
User can also use optional parameters to filter them, for example, many
people prefer MA 10 and 20 MA crossover when the price is trading above 50
MA or when 20 MA is above 50 MA
Price and Moving Average Crossover
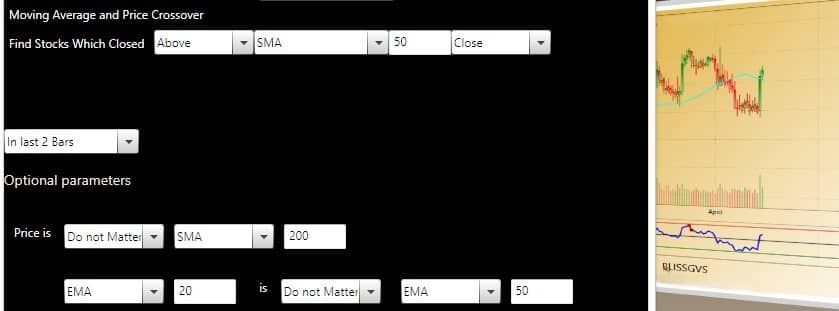
It scans crossover of price and moving average and optional parameters are same as MA crossover scan. This scan is available under MA Analysis option.
Typical Single MA Query
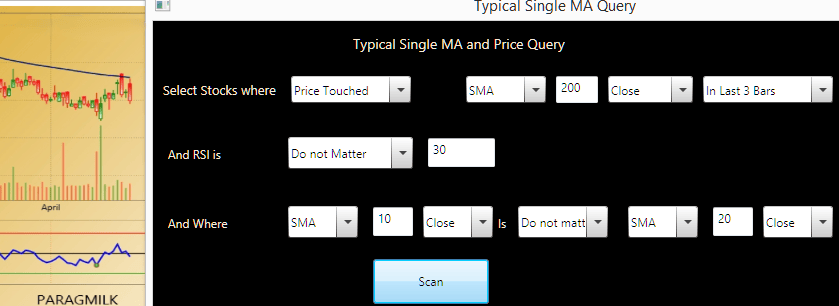
Similar to Price and moving average scan, it can scan stocks were price has
found resistance or support on MA under option Price Touched
It can also scan where full candle has gone above some MA , also MA and
SuperTrend cross is also available in this scan.
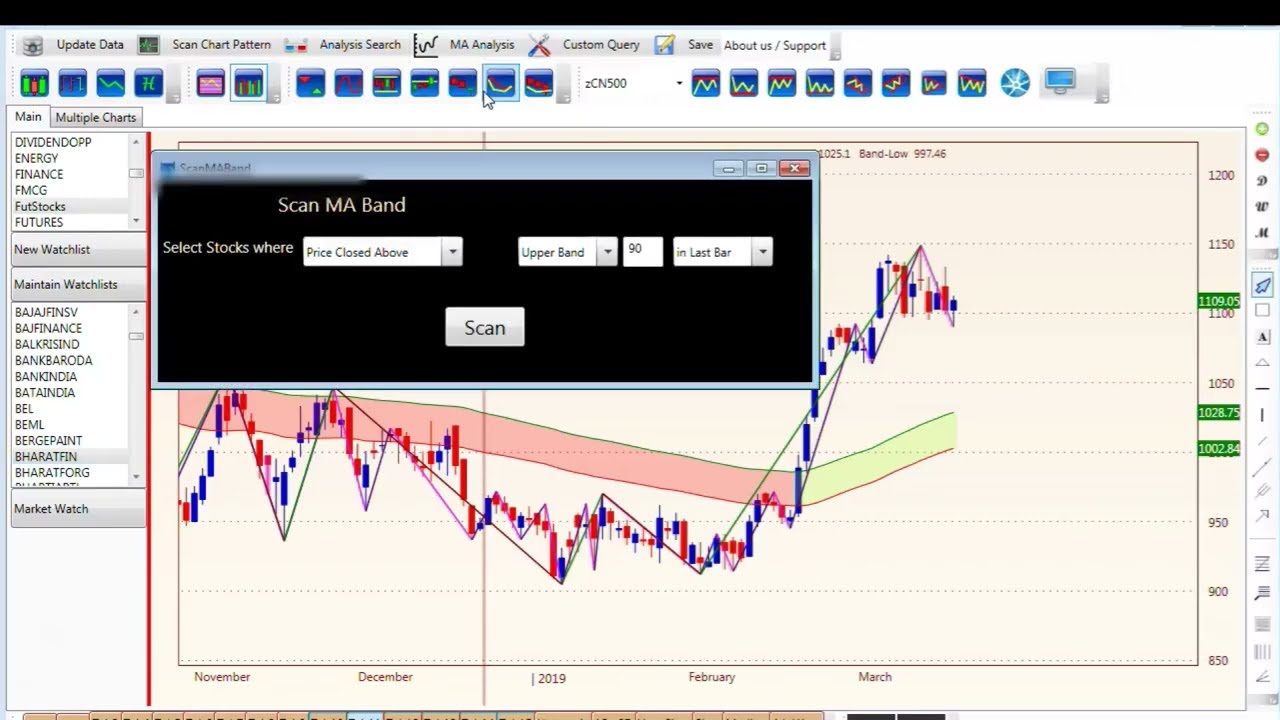
MA Band Scan
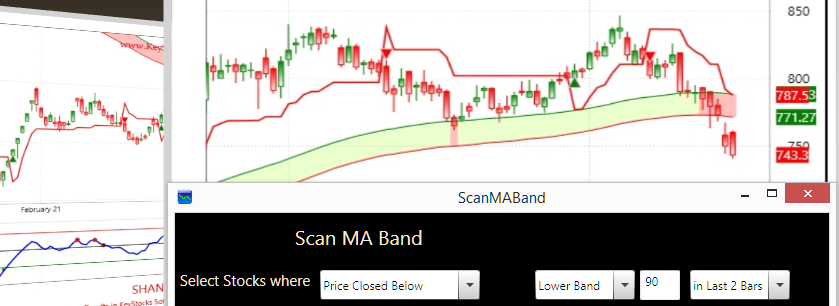
MA Band consists Moving average calculated on High and Low prices. Default
parameter is 90 so it means these 2 MA are MA 90 calulated on high prices
and low prices of last 90 bars .